I'll come back in ten days.
Good luck! Try your skills as I shown, it's not as hard as you feel.
Nice day, what a surprise :). Exactly as I told, bear-trap.
Cheers!
Thursday, July 22, 2010
Wednesday, July 21, 2010
Sold both units @1085 cash out, a little more than 6% in 1 month
Pretty good results in a volatile environment like this.
Tuesday, July 20, 2010
OPEX Wednesday
As I told in my prior post, market was ready for a bounce, and it made a nice correction.
Most probably this short-term bull will continue on wednesday, as usually happen on opex weeks. (wednesday rally, thursday bearish push down).
If it will, then we sell our both units around mid-day, wednesday. (Also, I will leave for a week and this strategy needs a daily control with 20-30 minutes of analysis).
So, let's see our 60 minutes ichimoku analysis. It has fallen out of safe zone for a while, but could recover quickly.
There is a new basis is building up around 1085.

Signs clear that fed is playing for a bear-killing bullish rally and then push bears to a short-cover situation will contribute to a longer-term upward move.
There is a good chance for a thursday-friday fight. This market is really hard to trade and volatile,
as you could see, this trading strategy does not try to trade every up and down swing.We are still behave as traders and sometimes we need to take profit.
(Personally I leave all my bulls in and o.k. with some correction as there is a strong and clear bullish setup building up with high probability materializing in 4-6 workdays).
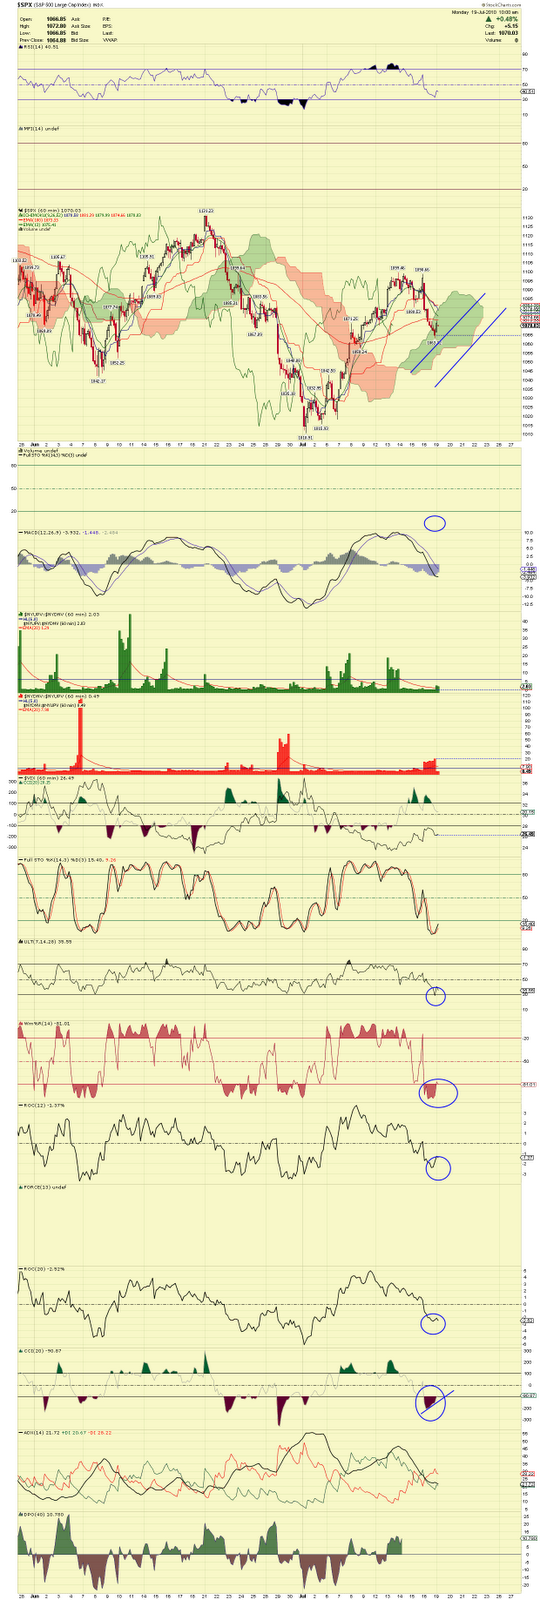
Monday, July 19, 2010
Overheated market - Cool down reaction
As I warned several times, market had an extreme overheated status for last Friday.
It was almost sure a correction will happen. What is a warning sign is the strength of the correction.
Following chart shows market situation, safety zone, danger zone and liquidation limit.
As it can be seen, almost all of the short-term indicatiors suggest a bounce.
 Daily volume analysis :
Almost all critical indicators show bullish signal, except on a rising selling volume signal. That gives a caution signal. Usually selling volume signal is flat zero in clear bull markets.
 60 min volume chart will be analysed EOD.
30 min volume analysis shows very slow selling volume elimination and selling volume elimination.
Close watch is necessary with a good chance of slow bullish change.
It was almost sure a correction will happen. What is a warning sign is the strength of the correction.
Following chart shows market situation, safety zone, danger zone and liquidation limit.
As it can be seen, almost all of the short-term indicatiors suggest a bounce.
Almost all critical indicators show bullish signal, except on a rising selling volume signal. That gives a caution signal. Usually selling volume signal is flat zero in clear bull markets.

30 min volume analysis shows very slow selling volume elimination and selling volume elimination.
Close watch is necessary with a good chance of slow bullish change.
Thursday, July 15, 2010
nice opportunity to make a new buy
Signals are that clear, this strategy buys a new unit.
Unit is a given unit of money, for e.g. 1k or 10k or 100k.
I will measure the performance of this stretegy by SPX points x units.
Unit is a given unit of money, for e.g. 1k or 10k or 100k.
I will measure the performance of this stretegy by SPX points x units.
Still nothing to worry about
Normal cool-down today.
Market made too fast progress so far.
However, all volume indicator shows bullish market setup.
Seems not easy but we keep our positions and let big guys to play their game.
Market made too fast progress so far.
However, all volume indicator shows bullish market setup.
Seems not easy but we keep our positions and let big guys to play their game.
Monday, July 12, 2010
Cool down phase
Nothing to worry about, stock were too hot (overbought). It's a short-term cool-down phase.
We keep our positions, still have nice profit so far.
We keep our positions, still have nice profit so far.
Thursday, July 8, 2010
Short term overheat
Typical short-term overheated status today.
Nothing to worry about, usual reaction after a big rise.
More confirmation at larger, 60 min, clear and usual ichimoku resistance battle.
That resistance must be eliminated today.
Clear bullish ichimoku channel setup on the way.

Volume indicators show eliminating bearish and rising bullish volumes. Less and less chance for bearish return.
AI volume filter shows slight institutional gain dump.
We are in with 1 unit since yesterday, nothing to do just sit back and enjoy the show. Let big guys do their game, we dont want to and can't ride all of their game.
Wednesday, July 7, 2010
Good signals - weak market internals
We are still waiting and observe.
What we see market is testing a new support.
Financials made strong and confirmed institutional bull volume insertion.
As financials always in advance of general market. Growth without financials lead most probably to correction.

Also, we can see short-cover effects (low-volume buys with large price effects and daily swings) last days.
Pretty usual symptoms when market tries to find and create bottom.
For this time, almost all bull retails are shaken out of their positions, retail bears in trap.


We have more and more good signals. SBV histogram is close to a signal cross, what means volume-based trend change.
As we can see, bearish volume is eliminating, but still under signal line.
Other analysis from non-public sources: AI institutional filter shows institutional buying patterns from several sources. Daily selling volume signal is declining, buying volume moved out its zero level. Today there is a possible signal of sell-volume local maximum.Sentiment is advancing.
All signals show possible bull rally, not all signals confirmed. Some small correction is expectable will result final and stronger signals. 60min analysis shows selling volume elimination, and bullish short-term confrimation (oscillator cross). Chance for bearish return is low.
 Gold seems finishing its correction.
What we see market is testing a new support.
Financials made strong and confirmed institutional bull volume insertion.
As financials always in advance of general market. Growth without financials lead most probably to correction.

Also, we can see short-cover effects (low-volume buys with large price effects and daily swings) last days.
Pretty usual symptoms when market tries to find and create bottom.
For this time, almost all bull retails are shaken out of their positions, retail bears in trap.

Wise bulls make ultra-light quantity buy and note this as a bottom. When signals are stronger then more and more buys need to be done. Some swings are expectable, lower than bottom price will be used as our immiediate liquidation level. Let's note: liquidation level is 1010. So, we can only loose our trading comission if we come back.
Some volume investigation:
1day chart:

We have more and more good signals. SBV histogram is close to a signal cross, what means volume-based trend change.
As we can see, bearish volume is eliminating, but still under signal line.
Other analysis from non-public sources: AI institutional filter shows institutional buying patterns from several sources. Daily selling volume signal is declining, buying volume moved out its zero level. Today there is a possible signal of sell-volume local maximum.Sentiment is advancing.
All signals show possible bull rally, not all signals confirmed. Some small correction is expectable will result final and stronger signals. 60min analysis shows selling volume elimination, and bullish short-term confrimation (oscillator cross). Chance for bearish return is low.

Thursday, July 1, 2010
Quick update
Still flat institutional buying signal, weak bull attempt end of day.
As we can see now, our method protects our cash.
Oil finally lost it's momentum.
As highlighted formerly gold had a decline.
No chart today, will try to explain the situation tomorrow.
Week-end bear prediction worked so far. We are waiting for selling volume elimination and strong signal of buying volume.
Subscribe to:
Posts (Atom)