Bull comes.
Just for fun, I'll make a nice entry and buy 1 unit of SPX soon.
What you can see now (EST 11. am) is an internal fight to eliminate yesterday's selling volume.
Have fun, good luck!
Tuesday, August 31, 2010
Monday, August 30, 2010
Hard to believe
Dear my Readers,
I know it's hard to believe, but there's a much bigger chance of bull swtich (70%) than down (30%).
2 of the 5 indicators have clear bull confirmation on R3k, other indicators easing.
Yesterday was a final day to buy calls cheap and pass puts in a good price.
1040 will be tested overnight, giving no chance to masses to enter, then news come and in a second these internals will manifest.
We are out, and even don't want to enter into this point.
Why should we take the risk ?
Strategy I show here buys at clear signals only, guarantees 85% or more chance for success.
Still, that will make nice money for us.
Try to be a predator, not a victim: wait, observe and try to catch a good and safe moment.
Patience and time is our friend. There is a possible 1 unit SPX buy today intraday.
You will see if I trade that in my trades.
Gold: still bullish readings. Waiting some correction to enter with one more unit HUI.
Monday Quick update
Dear Readers,
My beloved index, R3k, what is the market itself, just signaled bullish signal. Lower volume indexes will follow soon.
I owe you with the chart of SP Financials battle last friday. I'll make a dedicated post for that.
Good luck!
My beloved index, R3k, what is the market itself, just signaled bullish signal. Lower volume indexes will follow soon.
I owe you with the chart of SP Financials battle last friday. I'll make a dedicated post for that.
Good luck!
Week-End Summary
For sake of entertainment, let's check my recent forecast, and let's see how former week's guess worked:
http://smartmoneyvolume.blogspot.com/2010/08/week-end-summary_22.html

As we can see, the bearish scenario came into play.
My 60 min tuesday forecasted a possible trend support and change around 1040. As per moment that support worked, marked GAP magneted market upwards. We need to monitor whether this support capable to stabilize the market.
http://smartmoneyvolume.blogspot.com/2010/08/no-selling-volume-exhaustion.html

Market status:
SPX500 2 days:
SBV histogram eased 1%, still in negative territory. SBV oscillator does not show exhaustion, further bullish accumulation needed to give trend change signal. MV SB volume indicates 1% ease on selling volume, buying volume remains flat. Volume momentum oscillator rose (from minus 47) above critical level (minus 18) and targets upward area. This dramatic change suggests high probability trend-change.
Recent week's selling volume and liquidity pull-out made pretty large damage on market internals, last friday's rally resulted minor effect in long-term indicators, further bullish volume insertion needed to eliminate selling volumes and rise flat buy volume index from steady zero.
SPX500 1 day:

SBV histogram shows slow elimination of current selling wave, however far from a trend-change confimration line-cross event. SBV oscillator reached it's maximum and gave up 1% from -54 to -53. More bullish volume need to be inserted in order to reach -33 bull signal.
MVO oscillator exhausted. It means current selling wave finished it's most intensive part. Momentum AD volume oscillator (-30%) gained 10% and rose to touch the signal line to -20%. Volume based sentiment indicator rose 7 points to 37. Reaching 43 usually means possible sentiment change gives throttle to bull side.
SPX500 60 min:

I made detailed analysis in my recent post. All indicators suggest temporary rise will result further growth then overheated momentary market situation leads to few days slowdown in near-term (1-2 trading days)
GOLD miners 3day
As precious metals are small volume and volatile, 1,2 days analysis did not take place.
Four indicators of five give confirmed bull in play. Momentum fell to zero suggests minor correction then further, safe rise in prices.
Summary:
SPX500:
Most probable scenario is bullish. Market status is not safe. Weak internals and non-exhausting selling power suggest re-test of 1040 area, giving place to further buy volume entry on lower levels, then trend change upwards result clear bull conditions. Liquidaton, danger and safe zones marked below.
60 min spx

1day spx

GOLD miners, silver:
Gold started its rally and shows huge bullish volume accumulation last weeks. For a short period volumes suggest small correction. Stock market rise and possible QE actions will result fierce upward price changes. Silver's long period re-test of resistances has been broken, it's general and artificial undervaluation and accumulated underlying volumes hide behind, also general market conditions can result extreme bullish price changes, much larger than gold's rise.

http://smartmoneyvolume.blogspot.com/2010/08/week-end-summary_22.html

As we can see, the bearish scenario came into play.
My 60 min tuesday forecasted a possible trend support and change around 1040. As per moment that support worked, marked GAP magneted market upwards. We need to monitor whether this support capable to stabilize the market.
http://smartmoneyvolume.blogspot.com/2010/08/no-selling-volume-exhaustion.html

Market status:
SPX500 2 days:

SBV histogram eased 1%, still in negative territory. SBV oscillator does not show exhaustion, further bullish accumulation needed to give trend change signal. MV SB volume indicates 1% ease on selling volume, buying volume remains flat. Volume momentum oscillator rose (from minus 47) above critical level (minus 18) and targets upward area. This dramatic change suggests high probability trend-change.
Recent week's selling volume and liquidity pull-out made pretty large damage on market internals, last friday's rally resulted minor effect in long-term indicators, further bullish volume insertion needed to eliminate selling volumes and rise flat buy volume index from steady zero.
SPX500 1 day:

SBV histogram shows slow elimination of current selling wave, however far from a trend-change confimration line-cross event. SBV oscillator reached it's maximum and gave up 1% from -54 to -53. More bullish volume need to be inserted in order to reach -33 bull signal.
MVO oscillator exhausted. It means current selling wave finished it's most intensive part. Momentum AD volume oscillator (-30%) gained 10% and rose to touch the signal line to -20%. Volume based sentiment indicator rose 7 points to 37. Reaching 43 usually means possible sentiment change gives throttle to bull side.
SPX500 60 min:

I made detailed analysis in my recent post. All indicators suggest temporary rise will result further growth then overheated momentary market situation leads to few days slowdown in near-term (1-2 trading days)
GOLD miners 3day

As precious metals are small volume and volatile, 1,2 days analysis did not take place.
Four indicators of five give confirmed bull in play. Momentum fell to zero suggests minor correction then further, safe rise in prices.
Summary:
SPX500:
Most probable scenario is bullish. Market status is not safe. Weak internals and non-exhausting selling power suggest re-test of 1040 area, giving place to further buy volume entry on lower levels, then trend change upwards result clear bull conditions. Liquidaton, danger and safe zones marked below.
60 min spx

1day spx

GOLD miners, silver:
Gold started its rally and shows huge bullish volume accumulation last weeks. For a short period volumes suggest small correction. Stock market rise and possible QE actions will result fierce upward price changes. Silver's long period re-test of resistances has been broken, it's general and artificial undervaluation and accumulated underlying volumes hide behind, also general market conditions can result extreme bullish price changes, much larger than gold's rise.

Saturday, August 28, 2010
Thursday-Friday /how did it happen ?
My intention in this blog is to analyze current market status and try to find short-term future trend, but I feel we can make an exception now.
What happened behind the curtains ?
I'll use R3K as it's volume is twice bigger than SPX 500 therefore gives cleaner and stronger signals easier to read and demonstrate.
Let's see what happened on 60-min resolution:
On 25-aug 13:30 you can see sbv histogram indicates selling exhaustion. Selling volume is declining, and buying volume is rising. At this moment, we dont know whether it's the end of the current, larger selling cycle, and not just a preparation of further falls. Next day there is an anomaly in figures: steady buying volume and declining, latter advancing selling power with constant price-fall effect, while AD sentiment remains above 45. This is the moment when an analyst rises his head.
This is the setup what market leaves for next day.

But what happened in the background? Let's drill down to 10-mins threads!
First of all, you can ask: how can it happen with a steady buy volume while selling volume is changing? Price is a combination of volume and individual tick prices in a given time frame. With extremely small switches between buys and sells compressing or decompressing your ticker-level volume injection you can push or pull money out without price effect for a short period. Surface remains steady but there are changes in the background. Sooner or later changes will manifest in prices.

Phase1 :Please observe time length and aggregated volume vs price change. Big pressure, small result. This is the reason that decision is made 1 day ago to change the trend. Risk is too high to find buyer for a good price, and puts are expensive for now. There is no efficient and safe money-making opportunity in this side of the market.
Phase2: Last put-buy preparation: small buy volume injection, big price effect upwards.
Phase3: After opening, large but short shoot of selling volume attacks and it changes up trend made (buyup continues overnight).
Huge selling volume injection (red bar), in the last 3 minutes smarts release puts, buying more calls. Retails happy to buy cheap puts, and sell their remaining calls.
Phase4: Imminent price effect, can not be hidden anymore. Extreme big buying volume. Buy as cheap as possible, other smarts react/join to the party. At 2.p.m. they sit back and relax, volumes easing. PPT jumps in and performs a destroying, last slap on short side. (unusual big buying 60 min volume intraday starting 2 hours before closing bell)
It's all I can say. If we'd drill down to 1-min, traces of these volume changes and price effects cleaner but hard to recognize for ones have no experience yet.
As you can see, all the move can be seen on volumes and charts. It's not a rocket science at all.
Have a great week-end!
ps.: I will write the usual week-end summary tomorrow or monday. Subject is SPX, some R3K and GOLD as usual. Please bear in mind my GOLD ideas.
We are in with 2 units of HUI, and soon we'll have one more unit.
We have ZERO unit in SPX, maybe we'll buy 1 unit for a few days.
Friday, August 27, 2010
Extreme big battle and buy volume in SPX Financials - RIFIN short update
Dear my Readers,
Thanks a lot for your comments and reactions. I promise I'll answer your comments later.
As you could see they made the scenario I sketched pushing SPX under 1040. Everything happened in 3 minutes. I'll analyze that in few days.
As per moment (3 pm.) there is a huge battle between bears and bulls, in financials. Nothing is stable. As per moment selling volume does not want to eliminate, they keep on so bulls had to advance extremely fast upward to have positive price effect. You can see this internal fight if you check today's 60-min volume chart on $RIFIN.
Can you see? That happens only 8-10 times a year intraday. Smarts fight, and PPT is in with full power. Maybe it won't be enough, they run out of time.

Update (EST 3.10 pm) : Bears giving up battle on R3K.
Update (EST 3.35 pm) : RIFIN battle won by bulls.
Behind the curtains - Trend change setup
Just a quick note. Yesterday there was a big fight between bull and bear volumes resulted a complete setup change usually used by smarts to place their first eggs into the nest and go bull.
They are ready.
I will show you this setup in my week-end post. In nutshell, they
-step1.: perform and almost invisible sequence of manipulation that pulls prices up. While they do that, they pass their short positions to retails and go cash.
-step2.: Retails buy relatively cheap puts and wait further drop.
-step3.: Smarts use current sentiment with a two or three cascade further selling results price drop in calls and enter. This selling volume is 1/10th of the former day's selling volume, but results nice drop in prices.
-step4.: For now, they have a perfect setup. This is where we are now.
Further steps : There are tons of call stops @1039. As everybody knows that it's a no-man's land below that area.
If big guys in play, they'll push prices down under that level wit 4-5 points in te first one or two hours, triggering massive panic-sell.
That results fierce price effect down and they can buy calls again.
This is the method of a safe bottom-buy. Results is an upswing in prices.
As this few hours cycle is a low-volume manipulation, just to drag prices down in order to make safe dip-buy, upswing prices will result now a massive short cover results an upswing cascade again.
For that moment retails totally confused and miss the change.
As you can see both retail bulls and bears loose, smarts win.
If we see a huge power up in volumes around 1035 then we know that FED is also behind the market.
If we see market below 1030 then smarts made a decision: there is more business downside than upside.
I need to tell you that's a possible scenario as well! (probability is relatively small, as daily selling oscillators singal cycle-end, but it's possible)
As you can see, I did not make an attempt to trade scenario above.
It's a theory and commentary part, an intellectual game here in my post.
We trace smarts and their behavior by checking their signals. Let's sit back and enjoy the show.
I'll only buy with our bull strategy if volume signals are clear on 60-min, 1-day and 2-days charts.
As per moment, 15, 30 and 60-mins charts have this possible change and show the perfect setup for this scenario.
1-day and 2-day charts have no confirmation.
Have a great day!
Thursday, August 26, 2010
Good news
Quick update: After the 1st trading hour I can report you a bullish setup on 60 min chart.
It should be followed on 1 day, and later 2 days charts.
It means market is easing.
Gold started its never-seen hyperbolic bull. Silver will follow it soon.
1 unit HUI bought. Please be aware that precious metals are volatile and we plan to keep this unit for a month at least.
Good luck!
It should be followed on 1 day, and later 2 days charts.
It means market is easing.
Gold started its never-seen hyperbolic bull. Silver will follow it soon.
1 unit HUI bought. Please be aware that precious metals are volatile and we plan to keep this unit for a month at least.
Good luck!
A chart values hundred times a word.
Dear my visitors,
Many thanks again for visiting my site. I never-ever thought that I'll have this high number of readers. I hope I can serve you well and you will enjoy this small, educational blog.
This blog has been started with an intention to give information about my opinion regarding to the US market and precious metals. I've seen lots of retails and bigger investors lost their money in 2008. They lost their money and lost hope. They felt they'll never have their money back. I gave my help and we could manage to step to the path have the original back slowly. Volume study, experience and patience with professional approach with ZERO emotion can help.
It takes 3-4 times longer to get your money back than to loose that. Patience.
A friend of mine lost 80% of his capital in 2008. It's an 80% damage, and you need to make 500% of the remaining to have your original capital again. Impossible? No. It needs time. After 2 years he could reduce his losses to 20% from 50% meaning 250% growth. Patience, smart thinking helps.
Retails don't have money to employ hundreds of researchers and invest hundreds of millions of dollars to run AI-based high-tech algorithms calculating probabilities and future scenarios adopt to the present figures in milliseconds.
No. Retails can't afford that.
They can draw some charts, have some experience, follow some strategy or theory and hope.
Retailers like a farmer with a knife in jungle between predators.
Here we TRY to detect smart's move resulted by their change on large-capital index volumes. They can hide their moves in prices in individual stocks, they have tools to minimize their visibility in C/Ps, they try to hide their entries and pullbacks and be the first.
What they cant' hide is the change they make in volumes on aggregated levels. Of course, it will result a reactive strategy in our side, but I always emphasize: we detect here, so smarts will move first.
It means we will miss the top and bottom 10-15% and we concentrate to the remaining 80-90%. Maybe less. I feel that's still a nice and exciting business.
I always tell whoever asks my advices: please never try to pinpoint bottoms or tops. Let it do by others. Chasing the top or the bottom is a very expensive game.
Market behaves as you approach it. If you approach like a gambler, it becomes a casino. If you approach it with respect, it will start to respect you.
I suggest to approach market with respect. Market, like nature, works with redundancy. We don't need to deploy all of its small up and down swings. It's fairly enough if we catch it's longer-term moves. Also, sometimes some mistake or loss is in this business.
One needs to accept these rules and enjoy Mr. Market.
I have very limited time to make my posts. I wish I could give you more detailed charts and commentary.
Yesterday one of you asked an update. I made a quick one. Now I'm sharing some charts, so you can see them with your own eyes. If you want, please feel free to get a stockcharts account and marketvolume account, and play them by yourself. Please try to learn how to walk alone and have your own opinion.
Thanks again for your kind interest and visits.
R3K 2days:

R3K 1 day:

SPX 500 1 day:

HUI (Gold miners/Gold) 2 days:

Wednesday, August 25, 2010
Russel 3000 is easing
Russel 3000 -a large volume index- actually the market itself is hard to manipulate and shows plenty of things in advance.
I only have time for a quick update with no charts today.
R3000-1 day fakeout analysis: SBV histogram shows negative divergence suggesting a second, but exhausting selling leg. Today selling volume rose. There is a chance of re-test current cycle low in next 12-16 trading hours.
R3000-1 day analyisis: SBV histogram suggests temporary exhaustion of selling volume.
R3000 60 min: MV oscillator shows local maximum and immediate weakening volume. This usually means a further resistance re-test in next 12 trading hours. AD sentiment rose to 41, at 50 there is a chance to have temproary easing.
RIFIN: Financials 60 mins show confirmed temporary bullish signal. We need to wait till same happens on the 1-day chart.
In summary, market internals are easing, market status is not safe. A big volume up day might be able to change current trend, otherwise there will be a further selling leg.
GOLD: gold has a huge volume up on 3 days chart pushing selling volume down with an absolutely strong power resulting a huge rally up. If that upward momentum connects to general stock market easing, pushes stock prices higher resulting weaker dollar, gold will make a huge bull rally. Gold has an absolute bullish flag on all charts now. Tomorrow we will buy a new HUI unit.
Tuesday, August 24, 2010
No selling volume exhaustion
Today is the 4th selling day in a row. It's a clear bearish trend change signal.
If we take the week-end plan, our bearish scenario in play.
Let's see how predictions manifest.
60-min
1-day

Russel 3000: Weakening bearish daily oscillator. 2 and 3 day aggregated volumes suggest further drop.
SPX500: Weakening bearish daily indicators. 2 and 3 day aggregated volumes suggest further drop.
Gap has been left can be a target to a temporary bullish fake breakout.
Gold: Rising selling volumes suggest further drop.
Market status: NOT SAFE, CRITICAL.
Further note:
High volatility. VIX broke an important resistance.

Retails are not recommended to trade above VIX 30.
Many thanks for visiting my blog again.
Monday, August 23, 2010
Quick update
Just checked my blog. I have surprising big number of readers.
Many thanks for all of you for your kind interest.
My plan is to give 2 weekday update and a week-end one.
However I cant' resist to make a quick note:
SPX Financials and RIFIN daily: selling wave momentum is still in play.
SPX 500: selling volume is still in aggregation phase.
SPX 500 forecast: weak internals suggest further sell. Possible weekly bottom in 1-2 days.
We are still out, in cash with our trading system.
Gold: further correction expected. Our core position is being kept.
Sunday, August 22, 2010
Week-End Summary
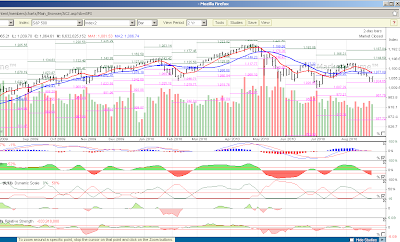
SPX 3-days aggregated volume analysis:
4 indicators from 5 suggest rising selling volume usually result more drop in prices
SPX 2-days volume analysis:
SBV Histogram is flat with a slight negative value, SBV Oscillator suggests still aggregating selling volume, SB Volume chart indicates buying/selling volume cross with descending aggregated buy volume and aggregating selling volume. Sentiment is in negative territory, under a critical level.
SPX 1-day volume analysis:
SBV histogram indicates rising selling volume, SBV oscillator shows strengthening accumulation of selling volume. Buying volume is steady zero, selling volume is rising. Momentum in negative territory under critical level, sentiment is under critical bearish level.
SPX 60-min volume analysis:
SBV Histogram shows a short-term exhaustion of current selling wave. SBV oscillator also confirms that short-term selling volume is not aggregating. MVO indicator suggests current selling cascade exhausted on 20-AUG-10 12:30. AD sentiment in critical negative territory. Momentum oscillator confirms short-term selling exhaustion.

Conclusion: Possible exhaustion next week on monday after-lunch hours, some short-term buyup can push prices higher. However, large amount of money has been streamed out of stock markets after pathetic days last two weeks made longer-term damage. Long-term, volume based trend forecast is DOWN with high volatility.
This damage will most probably manifest in further selling leg(s). Close monitoring needed.
Market status: NOT SAFE
Estimated next leg and support is marked in chart below:
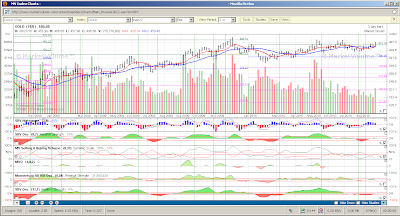
Gold:
3-5 % further correction is expected in next few trading days under HUI 450 is danger zone, liquidation level is under 430.
All long term (2,3,5 days) charts and analysis indicate rising buying volumes with high probability of upward price manifestation.
4 indicators from 5 suggest rising selling volume usually result more drop in prices
SPX 2-days volume analysis:
SBV Histogram is flat with a slight negative value, SBV Oscillator suggests still aggregating selling volume, SB Volume chart indicates buying/selling volume cross with descending aggregated buy volume and aggregating selling volume. Sentiment is in negative territory, under a critical level.
SPX 1-day volume analysis:
SBV histogram indicates rising selling volume, SBV oscillator shows strengthening accumulation of selling volume. Buying volume is steady zero, selling volume is rising. Momentum in negative territory under critical level, sentiment is under critical bearish level.
SPX 60-min volume analysis:
SBV Histogram shows a short-term exhaustion of current selling wave. SBV oscillator also confirms that short-term selling volume is not aggregating. MVO indicator suggests current selling cascade exhausted on 20-AUG-10 12:30. AD sentiment in critical negative territory. Momentum oscillator confirms short-term selling exhaustion.

Conclusion: Possible exhaustion next week on monday after-lunch hours, some short-term buyup can push prices higher. However, large amount of money has been streamed out of stock markets after pathetic days last two weeks made longer-term damage. Long-term, volume based trend forecast is DOWN with high volatility.
This damage will most probably manifest in further selling leg(s). Close monitoring needed.
Market status: NOT SAFE
Estimated next leg and support is marked in chart below:
Gold:
3-5 % further correction is expected in next few trading days under HUI 450 is danger zone, liquidation level is under 430.
All long term (2,3,5 days) charts and analysis indicate rising buying volumes with high probability of upward price manifestation.
Friday, August 20, 2010
Rising bearish volume

Non-public oscillators and AI selling/buying sequence recognition could not identify exhaustion.
We are still out with our strategy and waiting for entry of smartmoney. They usually start to enter when there is too much volume accumulation on one side. That means there is no further business on that side and switch (while retails usually join to the party that time and they can't make money or loose). We will recognize a little after they make the decision.

In my weekly reports I usually make a weekly plan. Above, as you can see my bearish scenario came into effect with few points of difference. Whoever is still in I suggest to save your money and liquidate @1060. Usually cloud fall-out means a trend-change lasts at least 10-15 days.
Gold: further correction is expectable, however, GOLD is bull in long term. We keep HUI in our trade. Maybe we loose a little, but we will not loose our core position. We will also try to add one more unit close to the bottom.
Thursday, August 19, 2010
Still out
SPX:
My warning worked, however volumes are easing. We are waiting for a clear bull signal.
Market might go up or down, we keep our eyes on indicators and waiting for safe and clearmarket.
GOLD:
Keep gold tight. Most money is made in long term by sitting tight.
My warning worked, however volumes are easing. We are waiting for a clear bull signal.
Market might go up or down, we keep our eyes on indicators and waiting for safe and clearmarket.
GOLD:
Keep gold tight. Most money is made in long term by sitting tight.
Wednesday, August 18, 2010
Upcoming further correction - WARNING
SPX: All 60-min, 1-day, 2-days, 5-days MV charts suggest further correction.
Gold: Minor correction expected.
SPX 60 min chart

Few charts will come later.
Gold: Minor correction expected.
SPX 60 min chart

Few charts will come later.
Tuesday, August 17, 2010
Nice manifestation as predicted, so selling on strength as planned
As our indices are still not on clear bull territory (however they are easing). We sell as it was planned in my week-end report.
SELL SPX @1095
Later I'll try to write a quick update.
We keep gold. As I wrote that's a longer term trade.
SELL SPX @1095
Later I'll try to write a quick update.
We keep gold. As I wrote that's a longer term trade.
Monday, August 16, 2010
Week-End Summary
SPX
Usually I only publish MV charts can be reached free in their trial period.
In this post I will show you charts can only be accesssed with MV platinum subscription.
I do it because I need to show you all the indicators mainly be used for volume-based analysis. It also supports my statements and predictions.
So, let's make a drill-down.
2-days chart:

2-days chart SBV histogram suggests an elimination of buying volume, however, it's still in buying territory.
SBV oscillator is under signal level, usually suggests trend change (too much buying volume aggregated, there is a possible upcoming correction to the selling side)
MV SB indicator clearly demonstrates collapsing buying volume and rising selling volume in effect.
MVO does not show peak.AD momentum oscillator is in negative territory.
Based on this analysis trend is DOWN. Magnitude is a question. MV SB volume and 1-day indicators will give answer for this question. If selling volume rises above 55-60% on 2-days chart it causes fierce price manifestation. Under that level it's a minor correction only.
Also the maximum level of buying volume can help us to estimate the magnitude of the correction: usually larger corrections happen if buying volume maximum falls from 60%+ territory with immediate fall to zero. Now maximum was 58% and we had a slow cooldown before final descent started.
Arrows show last correction started from much higher values.

1-day SPX chart
SBV histogram shows decline with growng momentum. SBV oscillator is on 5%, selling volume advanced buying volume. No peak detected.
Momentum is in negative territory, a little lower than critical level, but remains flat instead of sharp fall, what usually signals fierce correction. AD sentimen is just below the critical level, almost remains in the bullish territory.
1-day volume indicators show mixed picture about this correction. However, sentiment, one of the most important indicators suggest this is a minor correction with a possible quick dip.
Close watch of these indicators necessary. If sentiment and momentum goes down, it means not a correction but overall market fall.
60-min chart

This chart is the reason we made a trade last friday. It shows elimination of selling volume peak.
There is a high probability of a 8-10 point correction intraday on Monday. If we reach that level, then we perform a sell. If it reaches the suggested 1076 pivot minus 1-2 points, then we close our positions. Close monitoring will be made on monday.
Putting 60 min together with 1 and 2 days chartI expect further fall but not expect a big correction. However, monitoring 60-min chart and our limits will protect us against any major correction.
Ichimoku analysis:

Chart above made end of June.You can see, my estimation regarding to the trend and minimum target was pretty good. It's time to make a longer term vision about the market for the next few months.

As you can see, I did not make targets. Market is in a decision point. Targets will be set, if market finds a direction.What is important, we set our danger zone and liquidation zone for now.

60-min ichimoku shows market has lost it's cloud support and in bearish setup. Indicators below the ichimoku clouds show possible cloud target in progress.

NYMO chart shows we are over of safe bull market for a while. It's suggested to check NYMO as a daily routine and make a slow/fast AVG analysis. Smarts do the same. I marked those periods usually called as safe bull periods. Please observe that NYMO is compressing around 40, usually means a support will be found soon.

A50 also suggests a minor correction. Big falls usually come 400+. Now we came from 377.
Friday, August 13, 2010
Dip-buy spx @1079
SPX 60 min: selling signal exhausted on SBV histogram, 10%, SBV oscillator shows elimination of selling volume, MV SB selling signal is zero, volume-based AD sentiment and momentum also shows positive trend.
High probability of price manifestation on Monday.
I'll try to make some charts tomorrow.
Gold is still bullish.
High probability of price manifestation on Monday.
I'll try to make some charts tomorrow.
Gold is still bullish.
Thursday, August 12, 2010
Slow elimination
60 min chart market internals - volume analysis shows elimination of selling volume.
SBV histogram shows weakening selling signal, MVO indicator has a clear peak of selling volume at 13.30 today means selling exhaustion. Volume based quantitative sentiment and momentum indicators also show good possibility of selling elimination.
The only issue is no buying volume rising so far. Most probably bulls will attempt to push up indices after hours, pre-market and e-mini. However this volume is that strong I dont give hope for stabilisation, also friday trader's week-end sell off can influence or weaken recovery.

1 -day SPX chart: All indicators show bearish bias
2 -days SPX chart: All indicators show bearish bias
I'd like to rise your attention: there was no major volume sell-day yesterday nor today giving high probability of quick bull turn of stockmarkets. A light dip-buy tomorrow just before market-close maybe not a bad idea.
We still stay away of stocks. Let daytraders to play their game.
Gold: As I suggested yesterday there was a clear bullish volume setup manifested intoa price change today. As usual, rise happened mostly out of market hours. However, I initiated a trade with 1 unit HUI @456. Please note again, precious metals are extreme volatile, our target is to make profit in months. I expect 20-30% in 3 months.

Wednesday, August 11, 2010
Strong institutional sell signal
60 mins chart shows selling volume was rising while buying volume has been eliminated. Strong support found around 1090. After-hours analysis shows selling peak has reached it's maximum today, and market is ready for a slow recovery at least for a while.

What is more interesting, 1-day chart shows dramatic change in a day. Smartmoney made a decision to stream it's liquidity out of stocks. It happened too fast, triggering an immediate price manifestation. Selling volume rose to 9% from zero in a day. Daily SBV shows 4% positive signal with a high probability of crossing signal lines usually mean this cycle will reach an unsafe territory.
In a clear and safe bull market selling volume on AD indicator is flat zero.
Except on SBV Histogram, all other indicators show a possible trend change to bear.

Only hope for bull recovery is the 2 days chart. SBV oscillator did not reach it's critical 33% level, also SBV histogram shows 18% signal, that usually means market has enough power to recover. What is a negative sign, selling volume rose to 11% from zero in a day.

As you can observe, I did not indicate a new trade on SPX. Our strategy, the silly bull will wait for clear signals. And this market lost its power for a while. No dip-buy.
However, liquidity and inflation pressure is that huge it'll find it's place again in stock markets. It's only matter of time. It's not a must to trade every time.
Gold and gold miners: 60-min, 1-day and 2-day analysis shows that gold is cooling down from its overbought status. On both 1 and 2 day volume charts clear signals of trend change to bull from it's bearish cycle finished today and ready for a nice price manifestation.
I'd like to rise your attention: silver. We are very close to have a bounce.
Both silver and gold is a long-term speculation, a classic buy and hold-type of investment. I loaded more double long gold and silver today, also will make a HUI trade here in this blog tomorrow.
Inflation, our best friend is knocking on the door, so I'd not worry about stock market neither precious metals on long-term.
Tuesday, August 10, 2010
No surprise at all
As I told yesterday "2 of five indicators show weakening AD volume momentum. Volume based sentiment shows rising trend, usually pushes SPX higher". 60 min volume analysis clearly shows this manifestation actually happened in a day, flat selling volume signal on 1-day and 2-day chart clearly shows smart money used this moment to make a dip buy.
I'd like to emphasize: news almost always reactive instead of proactive, they try to explain things instead of forecast.
Now selling volume needs to eliminate on 60-min charts. It's a slow progress. Selling volume can not be identified as major institutional selling pattern (institutions as market makers trade in small installments in order not to change prices), so mainly made by retail. It means pretty fast elimination, then bull will return and manifest. (explanation: 1 and 2 day volume changes are major ones, they usually mean upcoming price manifestation. If volume changes cant' be shown, only on 60-min charts, then main trend remains unchanged.)
Gold will climb. I am sure I dont need to explain why. I made a new dip-buy today before the FED statement.
I promised some charts and more detailed analysis yesterday, however I am in constant lack of time to make them. Please try to log in to your marketvolume account (I hope you already have that) and use my oscillator setups to see how volumes changed. Also try to make 1 day and 60 min ichimoku analysis. You will see cloud support established on both scale and market is prepared to make a nice climb. I expect some nice rally this week, but then a slowdown or correction is pretty foreseeable next week.
I'll try to come back later today. If not, this short update comes tomorrow again.
Monday, August 9, 2010
Back
Hi, I am back, detailed post later, maybe tomorrow.
In Summary:
SPX daily : Still bullish readings, however 2 of five indicators show weakening AD volume momentum. Volume based sentiment shows rising trend, usually pushes SPX higher
SPX 2 day data: All indicators show bullish volume bias. Stable bull market signal.
Gold daily: Declining selling volume shows rising probability of bull. In progress.
Gold/Silver ratio (XAU): Advancing indicators suggest rise.
Wednesday, August 4, 2010
Manifested bull effect
Hi all,
Thanks a lot for your patience. I can see from my stats you were returning day by day to check if I am back.
So where are we now?
As I told in my post here: http://smartmoneyvolume.blogspot.com/2010/07/opex-wednesday.html there was a huge bull volume aggregating in background manifested in the time fence I estimated. For now we have a stabilized bull market with flat sell volume indicator and downsizing buying volume indicator. General volume is weak. Market became overheated, and cooling on the run.
 NYMO shows slow and safe cooldown from an extreme hot market status. As we can see we are very far from 13/34 bull cross. Smartmoney usually enters and exits between these crosses, remaining level is not safe.
Volume analysis readings:

Public MV Histogram and Oscillator show strong bull status of market. Volume analyis shows flat selling and strong buying volume. This is a pretty safe bull market status as well. Volume momentum gives strong bull signal, AD sentiment is far above the critical value. Again, bull volume manifestation.
For sake of fun I made a comparison my estimate vs reality. Please read my entry at : http://smartmoneyvolume.blogspot.com/2010/06/week-end-summary.html . You can find my estimation about the market there.
https://blogger.googleusercontent.com/img/b/R29vZ2xl/AVvXsEiknvgtD0K8pTylfCNRulJ0XOhs5hmAuysYtt_fX3NUOK7zaEX2ZZStoAywpUgu8-YXdLMdI2nMvWWBuzuWkoU8mgTYTTPEVLqYX-lVm2UifYXBbAgrab5eK23Qh16H2qgSvtTwZVHX8yM/s1600/stkchrtspx20100625_1D_zoom.png
Let's compare how did it happen?

As you can see, my estimate was pretty good. Surprising good. I dont make sport about predictions and don't like to make long-term charts. They mentally influence analysts and they want to see what they predicted instead of the reality. Also I don't believe in any kind of software or principle can make predictions a month in advance. Anyway it's a fun to observe whether I was right or not. It's all.
Market could manage to drill through on bearish cloud and now have strong and clear cloud support. Also need to note it reached and confirmed to hold again EMA200.
I expect some correction around 1060. Dollar is weakening, raw materials in a huge rally. This is a bull rally on liquidity, not on economical stability. Personally I made a huge buy on monday for gold miners and palladium.
Back to stock market I made a quick charts with the main lines, support, danger zones etc. as usual.

Maybe you ask me why am I talking about my trades if this blog aims SPX and concentrates large-volume indexes.
I help you to understand market behavior and help o demonstrate invisible and manifested volume streams, but I like to place my analysis into a larger context. I told you several times, this market is a struggling one. You can feel, it's running nowhere. But in this blog I don't give my detailed macro economical opinion, I am trying to concentrate to facts on stock-market. If I'd take the economical status of USA serious I'd be paralyzed and suggest to go cash and pray.
Back to gold and precious metals, all vectors show me to invest to gold. It's struggling now, and it's a very dangerous, low-volume segment, needs experience and good nerves. I'll keel update you about my opinion on gold and oil. As I am making volume-based analysis here, I'll give update about my readings on MV charst regarding to them.
I dont make tradings now, as I'll have a few days of sabbatical again starting tomorrow. Next week we will try to enter to the market and play a little just for sake to measure the performance of this trading strategy.
Thanks a lot for your patience. I can see from my stats you were returning day by day to check if I am back.
So where are we now?
As I told in my post here: http://smartmoneyvolume.blogspot.com/2010/07/opex-wednesday.html there was a huge bull volume aggregating in background manifested in the time fence I estimated. For now we have a stabilized bull market with flat sell volume indicator and downsizing buying volume indicator. General volume is weak. Market became overheated, and cooling on the run.

Volume analysis readings:

Public MV Histogram and Oscillator show strong bull status of market. Volume analyis shows flat selling and strong buying volume. This is a pretty safe bull market status as well. Volume momentum gives strong bull signal, AD sentiment is far above the critical value. Again, bull volume manifestation.
For sake of fun I made a comparison my estimate vs reality. Please read my entry at : http://smartmoneyvolume.blogspot.com/2010/06/week-end-summary.html . You can find my estimation about the market there.
https://blogger.googleusercontent.com/img/b/R29vZ2xl/AVvXsEiknvgtD0K8pTylfCNRulJ0XOhs5hmAuysYtt_fX3NUOK7zaEX2ZZStoAywpUgu8-YXdLMdI2nMvWWBuzuWkoU8mgTYTTPEVLqYX-lVm2UifYXBbAgrab5eK23Qh16H2qgSvtTwZVHX8yM/s1600/stkchrtspx20100625_1D_zoom.png
Let's compare how did it happen?

As you can see, my estimate was pretty good. Surprising good. I dont make sport about predictions and don't like to make long-term charts. They mentally influence analysts and they want to see what they predicted instead of the reality. Also I don't believe in any kind of software or principle can make predictions a month in advance. Anyway it's a fun to observe whether I was right or not. It's all.
Market could manage to drill through on bearish cloud and now have strong and clear cloud support. Also need to note it reached and confirmed to hold again EMA200.
I expect some correction around 1060. Dollar is weakening, raw materials in a huge rally. This is a bull rally on liquidity, not on economical stability. Personally I made a huge buy on monday for gold miners and palladium.
Back to stock market I made a quick charts with the main lines, support, danger zones etc. as usual.

Maybe you ask me why am I talking about my trades if this blog aims SPX and concentrates large-volume indexes.
I help you to understand market behavior and help o demonstrate invisible and manifested volume streams, but I like to place my analysis into a larger context. I told you several times, this market is a struggling one. You can feel, it's running nowhere. But in this blog I don't give my detailed macro economical opinion, I am trying to concentrate to facts on stock-market. If I'd take the economical status of USA serious I'd be paralyzed and suggest to go cash and pray.
Back to gold and precious metals, all vectors show me to invest to gold. It's struggling now, and it's a very dangerous, low-volume segment, needs experience and good nerves. I'll keel update you about my opinion on gold and oil. As I am making volume-based analysis here, I'll give update about my readings on MV charst regarding to them.
I dont make tradings now, as I'll have a few days of sabbatical again starting tomorrow. Next week we will try to enter to the market and play a little just for sake to measure the performance of this trading strategy.
Subscribe to:
Posts (Atom)