Monday, September 6, 2010

Week-End Summary

Dear my readers,

Just checked my stats. It grew with 712%. Thanks for that. I need to note something: I believe that volume based TA combined with classic TA and some economics is a great tool to be on the winner side of the market, but it's not the holy grail. It's pretty sure we will win more than loose, but loss is in this business as well. So please don''t expect too much. I am not a guru.

We had a nice week, as won nice sum on our HUI and SPX trades.

As usual, let's see how did the mid-week and week-end forecast work.

http://smartmoneyvolume.blogspot.com/2010/09/mid-week-summary.html

I was for bullish turn. It happened with huge momentum, so my forecast vs. fact is a little different. I did not count with this huge price manifestation, so my forecast was less 15-20 points vs fact.
What is a remarkable in this progress, the break of 1100 without any issue.
Also, market could not complete the rally without making a GAP.

Classic TA:

1d Chart from last week-end summary:

Good luck!


  Midweek week 60 min estimation:


Applying basic ichimoku analysis and some TA we can easily put critical targets and stops and possible short-term bull and bear scenario.
60 min SPX scenarios for next week:


Other market indicators

Let's read short-term indicators: RSI is high, MACD on top, fast signal is on it's way to cross, stochastics in extreme highs, ULT is above signal line, ROC 20 started to signal upcoming correctino, CCI shows correction is on the way as well.. After a rally like this it's not a question. The question is correction timing and size. Before trying to answer that question, let's make our routine check on some 1-day indicators:
NYMO 1d

NYMO 13/34 cross is a magnet for smarts push large volumes in or out. Smarts usually use 1/3 of a given rally to be in with full volume. That's the safest but not the strongest part of a given rally. As you can see, it's just a question of time when a bull cross will happen.
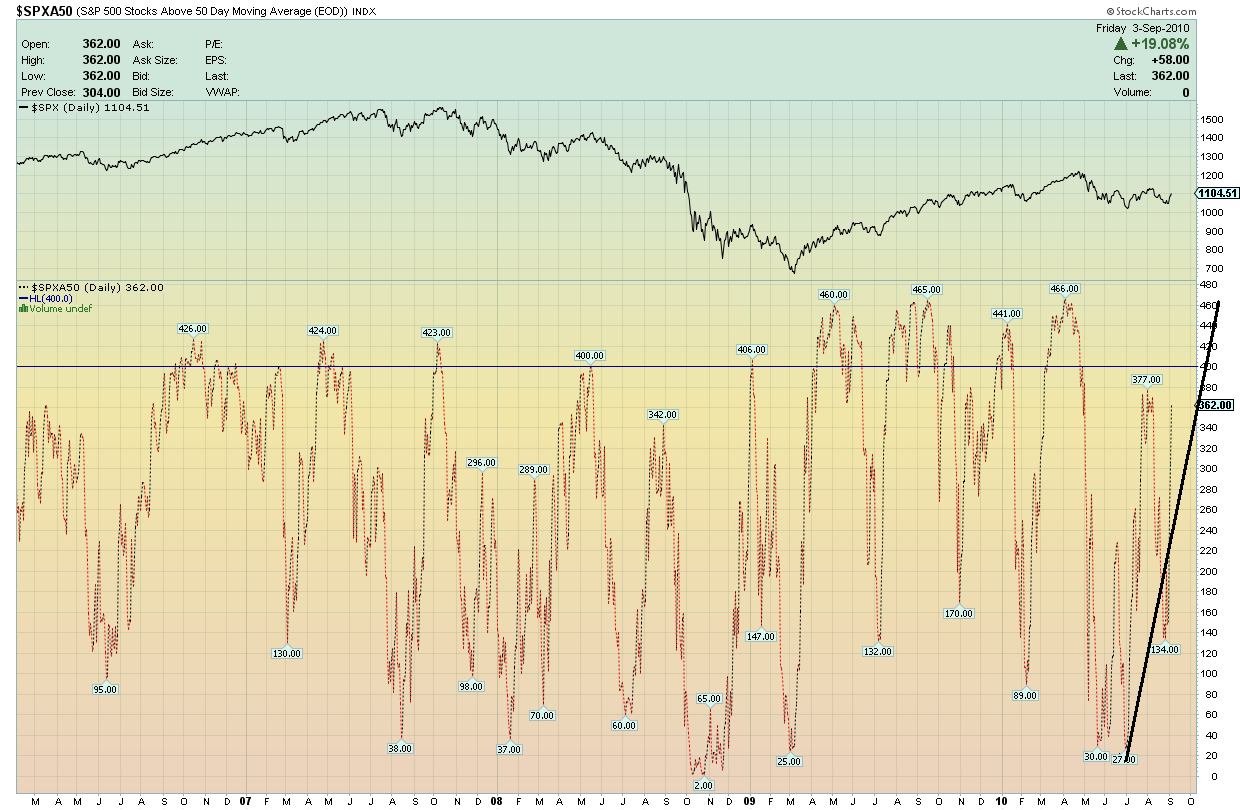
SPA50


SPA50 started to give some idea where the market goes.

Longer term scenarios:


1day classic TA gives a very good idea where are we know and where market goes in long-term:  RSI is still in a cold area. MACD has a confirmed bull cross. Stochastics has no bounce counts. Force indicator shows bull injection.VIX is extemely low, giving no space for long-term further growth of market. As it's a volatile instrument, I did not draw it's possible squiggles, only it's main trend. ROC12 is bullish, and TRIX has an imminent bullish confirmation TRIX is a slow, but reliable indicator. If it shows bull then it is here

Plenty of bull signals, with some overheated short-term status. Let's make some volume-based study in order to read what market tries to tell us, how big the correction will be and when will it come.

I am starting with my favorite giant, R3K 2 days chart:


 R3K 2-days chart tells huge volume insertion resulted long-term bull turn. Selling volume should eliminate to relative zero level and buying volume should grow with same momentum. Final bull-confirmation is at cross.


R3K 1-day chart:


1-day chart suggests confirmed bull. MVO suggests surge momentum of this surge has finished, market will have less fierce upward growth from now.

R3K60 min


MV Histogram shows no short-term bullish volume exhaution.SB oscillator shows no weakening in short-term bullish surge. Momentum indicator is still big, but shows some signals of exhaustion. Sentiment is above positive signal line. This value is in 80s, so needs 30 points of loss for a volume switch to short term bearish. 


PROGNOSIS:


From charts above, prognosis is to have some sideways move (next 6-12 trading hours) and a max 1-2.5% of correction (profit taking) for 8-16 trading hours or a little longer, then market will continue it's growth upward and attack AYH. Before that it must confirm this bull breaking 1130.


In case of a surprising bear case, our stops will be applied, still give some nice gain on this rally. Please observe I use no tight stop. This is a common mistake of non-pros;  tight, automatic stops and too high targets. It should be the opposite.


SPX:

SPX 2-days:


 Histogram gives positive, bullish signal. SB oscillator indicates long-term bearish exhaustion. Volume lines show dramatic damage on bearish volumes, and, in parallel bull side volumes grow with same momentum, indicating safe bull turn. Volume line signals will give further confirmation at cross.Momentum turned into positive. It's also a bullish signal.

SPX 1-day:


1-day indicators show clear bullish signals on all indicators.

MARKET FAKEOUT CHECK:

 R3K fakeout check is NEGATIVE.  Indicators show confirmed bull turn. For details about fakeout and it's volume-based TA check, please read my recent post. ( http://smartmoneyvolume.blogspot.com/2010/09/about-fakeout-analysis.html). Please find fakeout-check chart for R3K below. SPX looks similar.


GOLD 

and gold-miners are in long-term confirmed bull status. Precious metals are tight in volume, manipulated and volatile, so we make our analysis on  2 and 3 days aggregated volume charts. Even most of the pros dont even try to trade PM in short term.

Please observe that 2/3 of our trade in GOLD and 1/3 is in SPX. I will buy more HUI tomorrow. We will not trade it's squiggles at all. We buy and hold tight.
Again, there is a huge volume streaming into gold and silver sector. Smarts buy precious metals. Volume study of XAU suggest a big surge in silver price change, also nice gains in gold miners, less but still surprising growth on gold prices.

HUI 2 days:

Friday, September 3, 2010

The RIFIN battle

After reading my recent post about the basics of volume based TA please try to analyze the chart below:


As you can see, this battle was enermous.
In phase 1 and 3  following the indicators, especially the selling/buying volume indicator you can see a schoolbook-sample how a bearish cycle looks like.

Now, if you see phase 4 and 5, you will understand me. It's a clar signal, not all the smarts wanted this change. They seemed to agree in a bearish fakeout, but then, some of them made an unfair turn: they started to buy, buy buy and buy and other smarts did not give up their positions for days. The buyer side simply killed them, looser side could not get rid of their short positions.Their losses are huge. Then the fight seems to be won by bulls in phase 5. Trend changed. In next phase (just right to phase5)  you can see a small bearish cycle with a very low efficiency. Remaining smarts made an attempt to drag market, but they could not.
This fight was a total volume over 6.5 bn in few days and we are only talking about RIFIN, a relatively small-volume index. It was an extremely important point to save financials. They have serrious damage and all their indicators heading down. And, as you know, there is no market improvement without banks. RIFIN (high correlation with SPX financials) has been saved.

You can imagine now, how big that battle was and why did I give my respectful congratulations and expressed my thanks.

About fakeout analysis

Bull fakeout is an event, when smarts generate a quick trend-change in order to load more puts cheap, then drag market downward.
On 1-day chart fake brakeout is a maximum 2x2-4 trading days of action. Beginning of this trap starts like a bearish exhaustion (first 2-4 days).

They buy calls, then use relatively low volumes at the end of their bear cycles and drive prices upwards with a smashing bull volume insertion (please read my related analysis here http://smartmoneyvolume.blogspot.com/2010/08/behind-curtains-trend-change-setup.html and here http://smartmoneyvolume.blogspot.com/2010/08/thursday-friday-how-did-it-happen.html ).

Then, when others realize and want to ride the formed bull, smarts pass their cheap-bought calls to masses, buy puts chap and sink market leaving others loosing their money again.

In an event of normal trend-change they start the usual pass-over cycle with much higher volumes as they load more and more calls. They already passed the majority of their calls, and they don't want and don't letmarket go down enforcing short side to buy to cover spirals prices higher.
Smarts then let market run the bull into it's highes sentiment levels, when puts are extremely cheap and then they do the opposite of the bull-breakout preparation. This whole thing repeats again and again...

Let's define fakeouts:
Bull fakeout: Main trend is down, fakeout is a quick upward change then market continues down.
Bear fakeout: Main trend is up, fakeout is a quick downward change then market continues up.

How can we check whether we are in a normal bull-switch or in the middle of the fakout game of the big guys?

In order to understand the basics of bull-fakeout investigation I need to give some understanding about the principal of volume-based TA studies and give some understanding of MarketVolume charts.

Volume is the number of a share or a buch of shares (indexes) traded in a given time frame. Volume-based studies give an information about the intensity of trade. In each trading time frame there is a selling and buying volume. Sellers pass their stocks (or other financial instruments) to buyers. There is always a buyer for a given selling event, the question is the price of that transaction.

If there are more buyers than sellers, sellers have an option to choose buyers offer higher prices. If there are more sellers, then buyers have the option to choose the cheapest offer.

Cycles
Market characteristics has a cyclic nature. Let's start from a bullish recovery. At the end of a bear market the number of buyers are small, they can buy stocks cheap. As more and more participants join to the bull side, prices are higher as bullish side is surging. Everyone, even granma and granpa thinks it's time to jump and buy. At the end of the bullish cycle there are few bears only, puts are cheap.
On a given point of the bullish surge, smarts start to switch their positions in a very cautious manner masses cant' recognize in prices.Actually in most of case prices go higher and higher.
At this poin, aggregated volume oscillators show this weakening bullish volume surge.
This is the point when things start to be suspicious for a volume analyst.

This is the point when smarts prepare for a change. At a given point bulls want to take a profit will not find buyers ready to buy on higher prices. This is the moment when the number of buyers is very low and number of sellers is huge. Smarts already full with puts and they can enjoy shorting the market. Prices face down dramatically. Last bulls loose.

This is the moment, when remaining buyers will tell the price, and sellers have no option.  Now, all the bulls want get rid of their stocks and take profit. There is no buyer on their offered price, so they put they offer lower, it repeats while a buyer is comfortable with that price. This is a bear market. Now everyone joins to the bearish side, puts are being bought, short-selling is in ful steam. More and more seller means surging bearish volume.
At a given moment, bearish surge starts to weaken, however prices continue to fall. This is the moment, what we call bearish volume exhaustion, a possible bull trend change. Now stocks and calls are cheap and smarts buy them in small installments in order to prepare for the bullish turn, and they leave bear side gradually.This is the begining of the bull cycle.
And alll the same starts again and again...

Surge observation

We can observe these volume surges from 1-minutes of accumulation to years of accumulated volumes. Story is always the same, only price fluctuation is different.

It's a trader's decision which time-frame will be chosen.
For amateurs I suggest to use mid-term (several weeks to several months) or short-term (few days or weeks) time frame. Trading in lower time frame needs experience, therefore recommended only for professionals. Very low time frames (5 min, 1-min, less) are traded by algorithm-based computers as it needs constant,  concentration, risk analysis and margin calculation.

This blog deals with Mid-term and short term analysis and trade. It carries less profit, and lower risk.

Indicators

As I told, I am using Marketvolume in this blog as I did not find other volume-based tool available free for my readers. (free availability means 30 days and only some of their indicators available)

After discussing cycles and volume  surges, let's see what Marketvolume indicators can give us in order to monitor volume surges and detect anomalies can help to identify possible trend changes can help us to separate ourselves from masses and follow smarts.


On the chart above you can see price candles, volume bars as basic information.
Under date bar, you can see SBV histogram, SBV oscillator, SB Volume and MVO oscillator

SBV histogram has two lines. TA reading logic is very similar to MACD, however calculation is totally different. You can see volume surge intensity (bar histo), current market trend (blue signal advance means bullish, red signal advance means bearish market) and possible trend change (signal cross).

SBV oscillator is an area-type indicator. When area is green, majority of bulls rule, when area is red, bears rule the market. The intensity of current surge reflects to the value of this indicator. You can read the surging phase (divergece from zero) and the weakening phase (convergence to zero) of the current cycle from its value
This oscillator has two Oscillator signal lines, one in negative territory, one is in the positive side.
Critical point is a cross of oscillator line and signal line at weakening oscillator phase.


MV selling buying  volume indicator This is the most confusing indicator for beginners and most liked indicator for experienced ones. This indicator shows buying volume (green) and selling volume (red). I suggest beginners to concentrate to the volume crosses. Most probably that gives a confirmation of the trend change.

MVO oscillator This oscillator is an area oscillator. This indicator tries to locate the most intensive part of the given cycle. It starts giving signal when unusual intensity detected and eliminates as the intensity eliminates.
Signal is green at bull, read at bear.  This indicator gives valuable information to start heavy market participation and gives signal to change our bets lower level at signal exhaustion. Also if this oscillator gives opposite signal just right after the exhaustion, it's a trend change confirmation as well.

Trading system

So, let's build a very simple trading system:
We will try to locate the end of a bearish market and allocate the end of the bull market. We will use two of these indicators only, SBV histogram and SBV oscillator.
Our system:
1. Detect bear market.
2. Wait for SBV oscillator exhaustion signal. (value line crosses signal line). BUY
3. Keep position on bull market,.
4. Wait for SBV oscillator bull exhaustion signal (value line crosses signal line). SELL
5. Go to 1

Exception:
1. IF bull exhaustion detected (point 4) but, instead of bear turn, value of  SBV oscillator remains in positive area, make a BUY when SBV oscillator value line in bull surging phase crosses positive signal line.

Let's see how it works, running two backtests:


You can see two backtests in a merged chart.

On the upper side of the indicators (above MV selling-buying volume indicator)  I had no space to highlight all the trades according to our trading system, but I am sure as you follow the oscillator and indicator line, you will clearly see the trading points. Normal trades signaled with yellow, redundant (fakeout bear) trades signaled with pink callouts.

Upper indicators are set up to be more sensitive therefore result more trades and fake ones. It's still a nice money you can make by using this trading system, but we can fine tune that.

Below MV selling - buying volume indicator you can see less trades and less fakeouts.
We can reach this by giving different setup parameters to our indicators.
Indicators below have longer period setups. It results a less volatile indicator giving less trade signals, in turn, we will have less profit.

When both short period (above) and long period (below) setup oscillators give trading signals, that will filter us the fake trades.
Changing oscillator setups detect longer periods in same timeframe is the first method to perform fakeout-check.

Other possibilities:
a. Using different time-frames in our TA. For e.g. if we make trading decisions  using 1-day charts, we need to use 2-days charts in order to validate our trading signals. If 1-day trading signal matches or close to the2-day trading signals, that trading signal is valid. Shorter time frame is more sensitive, than longer, therefore we can filter former's fake signals
b. Using MV Oscillator. If MVO gives signal, and that signal ends with an immediate swap to the other side of zero line, (red from green or opposite) then we have one more signal it's not a fakeout.

Mid-week summary

As usual we check our week-end forecast vs. facts.

This is the forecast from last week-end:


And this is the current status of the market:


Summary: bull scenario is in play. ROC(12), CCI, also 60-min VIX-based CCI suggests an upcoming minor correction, however surging bullish volume on 1-day chart most probably will result further upward progress.


Bull rally could be completed without any major gaps. Week-end target 1170 has been completed, therefore we need to define new danger zone and liquidation points. Possible support, danger zone, ichimoku cloud support has been defined as below.

Thursday, September 2, 2010

Cooldown after a big rally

Market is stabilizing. More and more indicators confirm bull return in SPX.


After the rally market had yesterday, I feel it's normal.
Next step is to perform close monitoring of bull fakeout.
Late night or early morning tomorrow I'll write a post about the basics of volume-based fakeout analysis and will show you the battle of RIFIN.

As per moment there is a nice fight at semiconductors ($SOX) promises heavy bull turn and gain estimated to manifest in the next 16-20 trading hours.

Good luck!

Wednesday, September 1, 2010

Old Turkey

Bull came with full steam. Of course it'll loose it's current momentum. We made 35 SPX units. Did I sell it? No way.

Why? This blog aims to help to understand basics of trading. It's not a blog for PROs. They know this stuff. Please read few pages of my favorite book, "Reminiscenes of a stock operator"

We will not and don't want to trade all the market fluctuations in this blog.

Safe bull is very close. Almost all indicators turned positive on 1-day SPX chart. Well, we did not finish.
Market never lets us to sit back and have zero stress.
The second step after catching the bull is to check whether it's a fakeout.
I'll write a separate post about volume-based fakeout check methods soon.

Also, I'm preparing the RIFIN-fight I've promised last week.

I had a great day, leaving for a beer.

Good night!

Old Turkey:

"Most let us call' em customers -- are alike. You find very few who can truthfully say that Wall Street doesn't owe them money. In Fullerton's there were the usual crowd. All grades!Well, there was one old chap who was not like the others. To begin with, he was a much older man.

Another thing was that he never volunteered advice and never bragged of his winnings. He was a great hand for listening very attentively to the others.He did not seem very keen to get tips -- that is, he never asked the talkers what they'd heard or what they knew. But when somebody gave him one he always thanked the tipster very politely. Sometimes he thanked the tipster again -- when the tip turned out O.K. But if it went wrong he never whined, so that nobody could tell whether he followed it or let it slide by.

It was a legend of the office that the old jigger was rich and could swing quite a line. But he wasn't donating much to the firm in the way of commissions; at least not that anyone could see. His name was Partridge, but they nicknamed him Turkey behind his back, because he was so thick-chested and had a habit of strutting about the various rooms, with the point of his chin resting on his breast.

The customers, who were all eager to be shoved and forced into doing things so as to lay the blame for failure on others, used to go to old Partridge and tell him what some friend of a friend of an insider had advised them to do in a certain stock.They would tell him what they had not done with the tip so he would tell them what they ought to do. But whether the tip they had was to buy or to sell, the old chap's answer was always the same. The customer would finish the tale of his perplexity and then ask: "What do you think I ought to do?"Old Turkey would cock his head to one side, contemplate his fellow customer with a fatherly smile, and finally he would say very impressively, "You know, it's a bull market!"

Time and again I heard him say, "Well, this is a bull market,you know!" as though he were giving to you a priceless talisman wrapped up in a million-dollar accident-insurance policy. And of course I did not get his meaning.

One day a fellow named Elmer Harwood rushed into the office, wrote out an order and gave it to the clerk. Then he rushed over to where Mr. Partridge was listening politely to John Fanning's story of the time he overheard Keene give an order to one of his brokers and all that John made was a measly three points on a hundred shares and of course the stock had to go up twenty-four points in three days right after John sold out. It was at least the fourth time that John had told him that tale of woe, but old Turkey was smiling as sympathetically as if it was the first time he heard it. Well, Elmer made for the old man and, without a word of apology to John Fanning, told Turkey, "Mr. Partridge, I have just sold my Climax Motors. My people say the market is entitled to a reaction and that I'll be able to buy it back cheaper. So you'd better do likewise. That is, if you've still got yours."

Elmer looked suspiciously at the man to whom he had given the original tip to buy. The amateur, or gratuitous, tipster always thinks he owns the receiver of his tip body and soul, even before he knows how the tip is going to turn out."Yes, Mr. Harwood, I still have it. Of course!" said Turkey gratefully. It was nice of Elmer to think of the old chap."Well, now is the time to take your profit and get in again on the next dip," said Elmer, as if he had just made out the deposit slip for the old man.

Failing to perceive enthusiastic gratitude in the beneficiary's face Elmer went on: "I have just sold every share I owned!" From his voice and manner you would have conservatively estimated it at ten thousand shares.But Mr. Partridge shook his head regretfully and whined, "No!No! I can't do that!": 'What?" yelled Elmer. "I simply can't!" said Mr. Partridge. He was in great trouble."Didn't I give you the tip to buy it?""You did, Mr. Harwood, and I am very grateful to you.Indeed, I am, sir. But --" "Hold on! Let me talk! And didn't that stock go up seven points in ten days? Didn't it?""It did, and I am much obliged to you, my dear boy. But I couldn't think of selling that stock."

"You couldn't?" asked Elmer, beginning to look doubtful himself. It is a habit with most tip givers to be tip takers."No, I couldn't.""Why not?" And Elmer drew nearer."Why, this is a bull market!" The old fellow said it as though he had given a long and detailed explanation."That's all right," said Elmer, looking angry because of his disappointment. "I know this is a bull market as well as you do. But you'd better slip them that stock of yours and buy it back on the reaction. You might as well reduce the cost to yourself.""My dear boy," said old Partridge, in great distress "my dear boy, if I sold that stock now I'd lose my position; and then where would I be?"

Elmer Harwood threw up his hands, shook his head and walked over to me to get sympathy: "Can you beat it?" he asked me in a stage whisper. "I ask you!"I didn't say anything. So he went on: "I give him a tip on Climax Motors. He buys five hundred shares. He's got seven points' profit and I advise him to get out and buy 'em back on the reaction that's overdue even now. And what does he say when I tell him? He says that if he sells he'll lose his job. What do you know about that?""I beg your pardon, Mr. Harwood; I didn't say I'd lose my job," cut in old Turkey. "I said I'd lose my position. And when you are as old as I am and you've been through as many booms and panics as I have, you'll know that to lose your position is something nobody can afford; not even John D. Rockefeller. I hope the stock reacts and that you will be able to repurchase your line at a substantial concession, sir. But I myself can only trade in accordance with the experience of many years. I paid a high price for it and I don't feel like throwing away a second tuition fee. But I am as much obliged to you as if I had the money in the bank. It's a bull market, you know." And he strutted away, leaving Elmer dazed.

What old Mr. Partridge said did not mean much to me until I began to think about my own numerous failures to make as much money as I ought to when I was so right on the general market.T he more I studied the more I realized how wise that old chap was. He had evidently suffered from the same defect in his young days and knew his own human weaknesses. He would not lay himself open to a temptation that experience had taught him was hard to resist and had always proved expensive to him, as it was to me. "

Wednesday - commentary

Dear my Readers,

Your number is growing every day. If my statistics was a stock, I'd start to think to buy it :).
Usually I try to use my neutral tone while I give my analysis about the market.
I write my analysis in a close-to-meditative state of mind, and try to be as cold as possible.

Please let me write this post as a commentary meaning more emotion than usual.

First of all, you can ask me: why did you buy one unit just for fun, if you emphasized safe entry in your prior post?? Man, dont play with us!

Well, I am not playing, I really enjoy these times and have fun, but I made that decision on a very solid and conscious manner.

Let me show you why;  we have 79 points of profit, so we can take the risk.
For the time I made that buy it was the 9th time SPX 1040 has been saved, there was one further save.
Look, big guys made a decision.

They play their usual "pass the residual to others" game, this is the 5th trading day they are passing and passing. And they are telling telling and telling.

It's a mantra, they came 2 inches close to your ears and tell: "Come with us, we leave soon, don't try to step in front of us, sit down, here is your place, dude, dont attack 1040, we will smash you, dude, make money on our side". Ben also stood up and told his jumbo jet is here, sit in, close your belts and he will pull that stick soon, don't step in front of him.

This, 10 times of mantra and open speech from market makers is a rare event, extremely rare. This time they wanted to help for masses. They did everything for retails I feel. Also the fight they made was extreme. If you follow prices only, you saw a small part of that fight, but if you open internals and check how huge selling volume has been eroded and how, and how wide front did they defend and won, you'd be impressed, deeply. They also gave time and place for masses to enter to bull side and get rid of bear bets at a good price. They were very nice this time.

Actually, with my buy, I feel like a small parasite-fish just popping up and jumps to enjoy some juicy meal of the tired body of the winner....

I am impressed because this time not all the big guys were on same side. Situation was very critical.
I could recognize their fight. It was like orcas' fierce fight against each-other: water is full with blood around, but  the red surface is silent. Participants lost this fight for now, will come back, I am sure as their loss is huge.

But Ben, FED and their friends want and do everything they can to save US economy and stock market for a while. At any price.

Thanks for that, big guys. Your effort is tremendous, but I am sure you know, nature of the market is different. Anyway, thanks. US is a proud and great nation and I feel it must be defended at any price.

We need to be prepared if they'd loose the fight. Chance is very low, we cant' predict everything. There can be a natural phenomenon, a disaster or a sudden news bears can use as their last gun, last chance to attack and drag market downwards.

Look, if 1040 falls, bear market is here.
Under 1020 several theories, principals, TA supports etc. will give confirmed bearish signals used by all, big and small market players. 200 MA is turning downwards: it was a must to act against that. And that storm, if comes into effect will be enormous.

I say, let's use 1037 as our selling signal then. If that's in play, we will have 8 points of loss. Come on, it's a nice risk/reward ratio isn't?

Please try to use your knowledge: Which scenario would you choose after checking this chart ? Bull or bear ?


If everything goes well, you'll see miracles and sparks today and after. All of that is a result of this huge fight big guys made. That fight injected huge bull volumes and that will manifest.

Again: news will be matched afterward, big guys did everything in advance. And now they helped you, you cant' say they did'nt.

Good luck, have a great day!