It seems market continues it's weak performance. In order to understand the underlying movementes we need to make VTA on different time-frames starting from long-periods to short periods.
Ususally I don't show longer periods than 2 days, but lets check the 4-days RUA analysis.
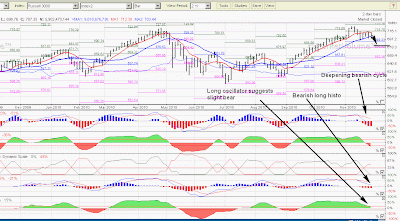
One bar represents 4 trading days, and it has huge underlying volume (~20Bn) therefore it's reliability is pretty high.
4-days RUA:
4-days RUA should be read with a different eye. As I told the dynamics of this chart differs from the short periods. So a sympthom needs to be taken with caution, once it has an indication that is almost sure, it will happen. However, please don't be scared seeing clear bearish indication on the chart. World will not collapse, market was too hot and now it cools down.
We can count with further 3-5% of fall at least.
2-days RUA:
Every second day this chart produces one bar and additional information. Yesterday it was the first day of the new bar and it had almost same histo bearish level than the former 2 days. Buy volume remains flat zero, selling volume is above the critical level.
2-days RUA Fakeout analysis:
So far pretty good, long and short period oscillator/histo is not in sync, therefore it seems market still has lots of bullish volume accumulation secures market against major correction.
1-day RUA:
We had a very weak bullish cycle manifestation, seems we need to count with one more bearish wave.
60 min RUA:
It seems a short-period bearish cycle just finished on Monday. We can obtain important information from Tuesday's bull cycle. In reflection of the higher time frames I suppose we have a high chance that for a double bear.
USD 1-day:
It seems USD continues it's bullish rally. It defined a bullish recovery, has smart-buy signals as well.
Please observe, in intraday charts USD/SPX has a strong impact on market. Ben has an extremely strong tool to rise market if feels unsafe market condition is not charming enough. As he said his purpose is inflation, and FED just announced QE2 shorting this market carries extreme risk.
HUI 1-day
Weak bull manifestation can be observed in gold miners.
XAU 1-day:
Same weakness on gold/silver sector.
NYMO:
Nymo had a critical low level and showed nice bounce and progress so far, however, yesterday slightly fell out of the trend line.
SPXA50
It's very hard to imagine any major fall from this level. Shocking or flash crash corrections occur from 400 above level.
We can count with some further correction, but market nicely cooled down and just waiting for some further correction, then it continues it's rise.
I might sell 1-2 HUI on Tuesday with a purpose to buy back cheaper.
Good luck!


No comments:
Post a Comment